Guide to the Basics
Desmos allows you to visualize equations quickly and accurately, which will provide you an enormous advantage in a timed SAT environment. The goal of this section is to teach you all essential graphing foundations and shortcuts so you can solve typical SAT problems faster than doing the algebra by hand.
Creating Functions and Setting Equations Equal
Typing an equation into Desmos instantly generates the corresponding graph.
This saves significant time compared to manual drawing.
Example:
- y = 20x + 5
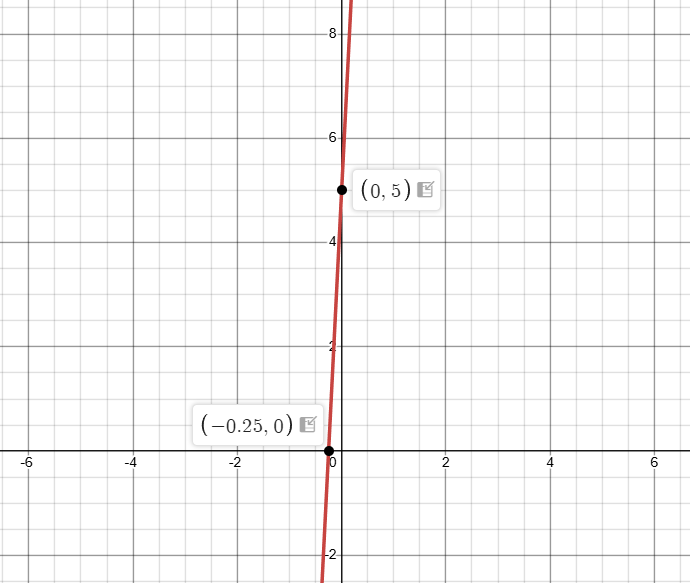
Desmos immediately graphs the line.Hovering over the graph reveals the y-intercept (0, 5) and the root (-4, 0). These points would take much longer to find by hand.
This can be done with any other graph like:
- y=x^2
- y=x^3
Even some absurdly long and complicated function can be graphed with ease:
- y=10x^100-x^87+x^34+2x
Note: the ^ symbol is to represent an exponent and it can be used in desmos to create exponents
Lets look at another example:
- 10 + a = 20
Desmos only recognizes x and y as graphable variables. Replace a with x, type 10 + x = 20, and Desmos shows a vertical line at x = 10, meaning a = 10.
.PNG)
.PNG)
Functions can also be set equal to f(x) or g(x). Any letter can be used to represent the function
.PNG)
Notice how we can plug in values of x and instantly obtain values of y
Systems of equations
You can enter multiple equations and Desmos will show all graphs at once. Intersections are automatically highlighted and can be clicked for exact coordinates. (This replaces lengthy algebraic solving.)
Example:
- y=5x
- y=-2x +5
.PNG)
.PNG)
Inequalities
You can graph inequalities by typing <, >, <=, or >=.
- Shaded region = all solutions
- Unshaded region = not solutions
- Dotted line (>, <) = boundary NOT included
- Solid line (≥ , ≤) = boundary included
Example:
- y ≤ 10x
.PNG)
The shaded side contains all points that satisfy the equation.
solid — meaning points on the line count.
Another Example:
- What is the greatest possible integer value of x?
- 3y < 7
- x < 3y + 4
.PNG)
.PNG)
- Notice how we can just plug in both equation and still get a graph
- It asks for the greatest integer value, so since x=11 is on the dotted line we look at the integer before that x=10
- Note: integers are whole numbers that can be positive, negative, or zero, cannot be a decimal.
Slider and range
Any variable other than x or y becomes a slider automatically. Sliders let you adjust values and instantly see the graph change.
Example: Passing through a point
- The function y = a·x pass through (1,20)
- find a
We can set a as a variable by setting a = [any number]
Once we do that we can access the slider function directly under a, changing a's value from -10 to 10
Note: as a reminder we can type the coordinates (1,20) and plot the point
You will notice that the line will still not go through (1,20) so we must extend the range of a.
.PNG)
By clicking on -10 or 10 we can modify the range and in this case we can set to this -10 < a < 30
Now by sliding all the way to 30 we can see there is some value of a where the line intersects the point. By futher playing with the slider we will see at a=20 the function will intersect that point
(2).PNG)
Harder Example:
- x(r-7) + 3 = 19x + 25
- If r is a positive intger and the given equation has exactly one solution what CANNOT be the value of r?
- A. 3, B. 9, C. -15, D. 26
.PNG)
.PNG)
We can see that B is wrong because when r=9 both lines will intersect once. Let's try extending the range to 30 and slide to r=26 since the highest answer choice is 26.
.PNG)
at r=26 we can see that both lines are parallel, meaning that they will never touch each other. Therfore, this D. 26 must be the correct answer
Tables
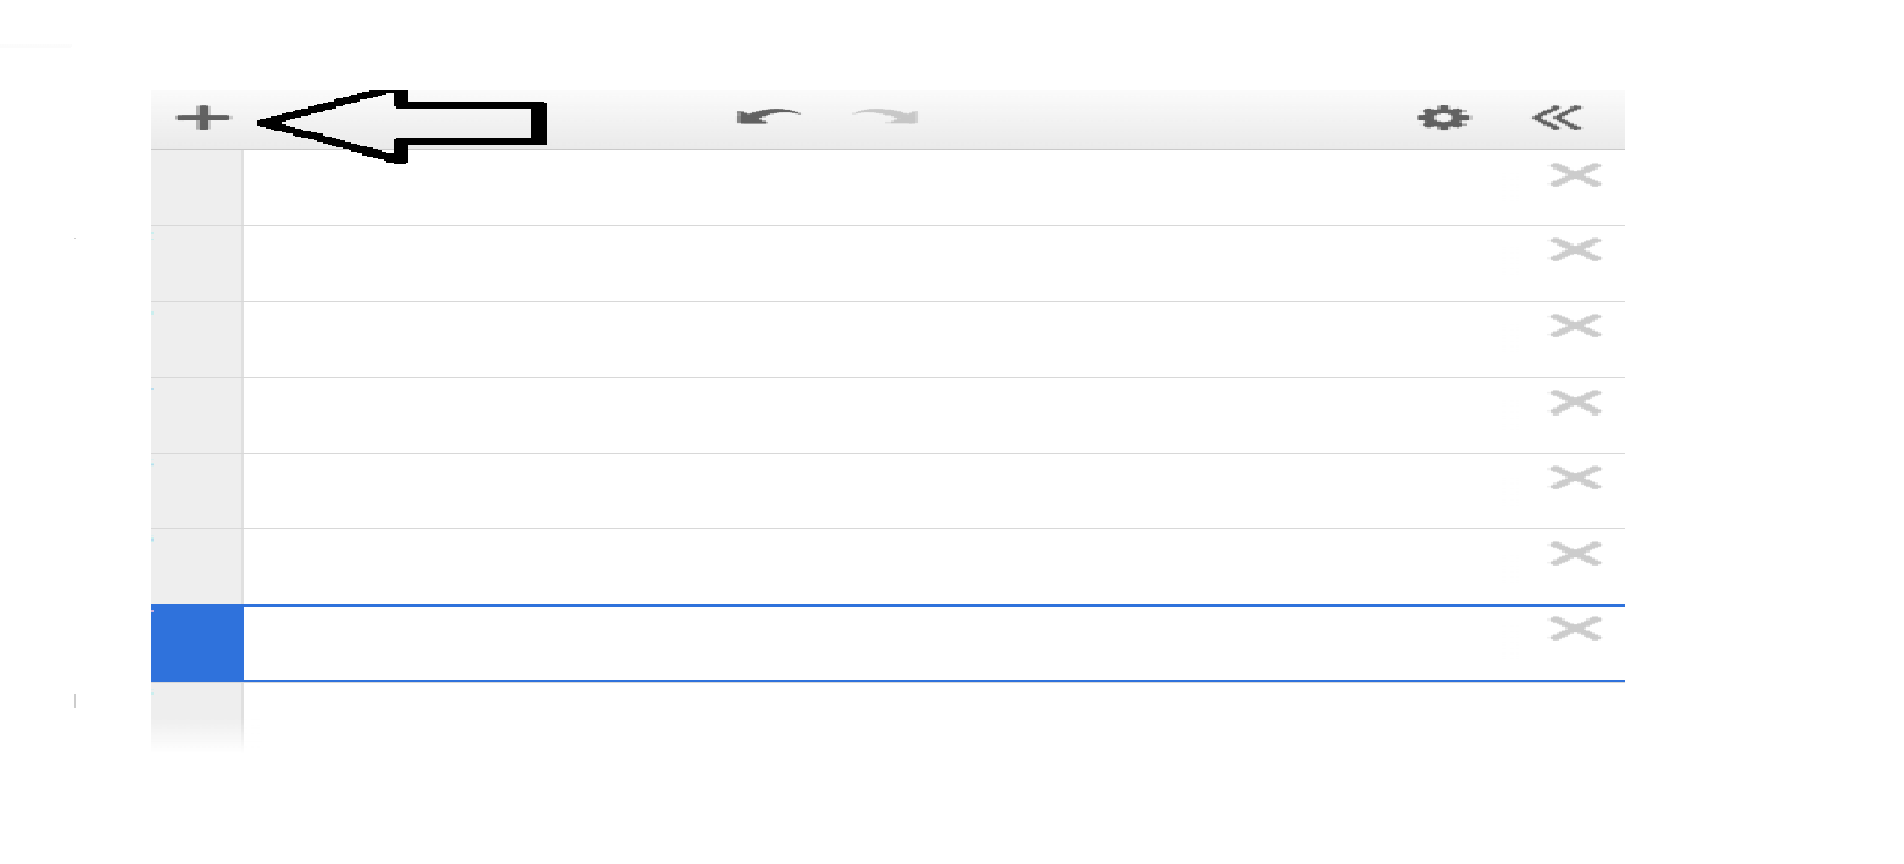
By clicking on the plus sign in the top left hand corner we can create tables. This will greatly save us time on questions where many points are given
Example: Plot Points
- Points:(1,1),(2,2),(3,3)
- What function do the points make?
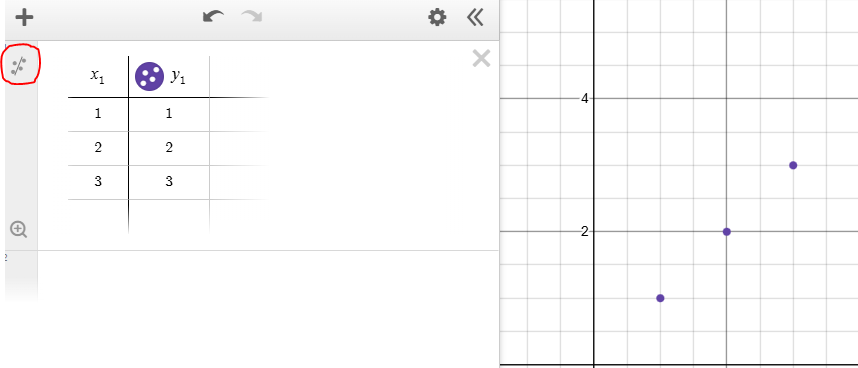
Those who are obervant enough will recognize that this is y=x, but for questions where the function isn't as obvious, we can use the regression function circled in red
.PNG)
.PNG)
- Regression will find the line that explain the spread of the points as shown above.
- How well a graph is explained is shown through R²:
- When R² = 1 the derived function is a perfect fit for the points
- When R² = 0 the derived function will poorly represent the points
- You may have noticed r. This is used to determine the correlation for linear lines which follow the same logic as R² mentioned above. You will not see r for quadratic and other non-linear functions
Harder Example:
- Points:( k+4 , 5),(k,3)
- (k+4, 5) is the y-intercept of the line
- What is the root
- Notes: the root is when the function touches the x-axis (x,0) and the y-intercept is when the function touches the y-axis (0,y)
- since we know that(k+4, 5) is the y-intercept that means k+4=0 as x will always equal 0 for y-intercepts
- Now we can plug in the coordinates, leaving in k as we will set a variable k = -4
.PNG)
.PNG)
Our y-intercept is at (0,5) which satisfies the condition above and we can see that the function touch the x-axis at (-10,0)
Other Keyboard shortcuts and tips
- sqrt(x) → √x
- cbrt(x) → ∛x
- nthroot → n√x
- Gives you the ability to manually plug in n by clicking on the small open box that is outside the radical
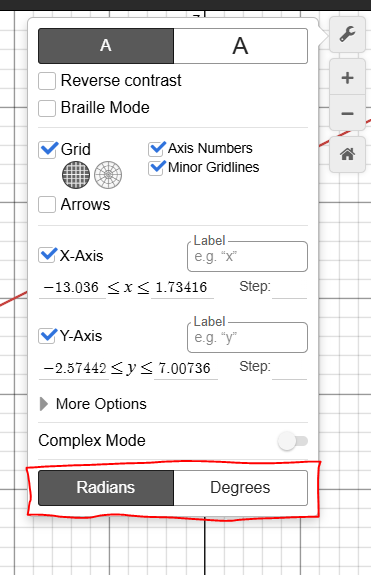
- You can manually type in Trig functions but be aware it is set to radians on default
- This be be changed by clicking on the wrench in the top right hand corner
- This be be changed by clicking on the wrench in the top right hand corner
- distance((x1,y1),(x2,y2))
- Finds the distance between two points. You could also set the coordinates as defined points
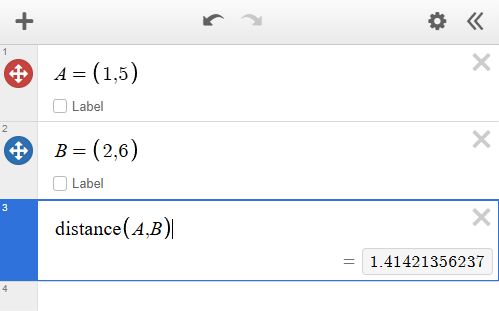
- Finds the distance between two points. You could also set the coordinates as defined points
- pi → $$\pi$$
- mean()
- Finds the average value of a set
- median()
- Finds the middle value of a set
- mode()
- Finds the most frequent number in a set
- stdev()
- Finds the standard deviation of a set
- range()
- Finds the difference between the higgest and lowest value of a set
- % → % of
- removes the need of converting percentages to decimals
Trigonometry and Geometry
Statistics
you will need to manually plug in each data point to find the mean, median, etc. of a set